TECHNICAL ANALYSIS
Pivot Breakout Boxes: How I Trade the Range Before It Breaks
Most breakout setups fail because they are built around a single candle. Here is how I trade the range itself.
Most breakout setups fail because they are built around a single candle. Price closes above a level, the candle looks strong, and by the next bar it has already reversed. A pivot breakout box fixes that by making the range itself the level, not one candle inside it.
What a Pivot Breakout Box Is
A pivot breakout box marks the range price has been coiling inside before it moves. Instead of watching one line, I am watching a box: a high, a low, and the space between them where price has been going nowhere. When price closes outside that box, that is the break I am trading, not a single candle poking through a moving average.
The box does two things a single line cannot. It shows me how tight or how wide the coil was, and it gives me a level with actual width, so a break has to travel through real space before it counts.
Why the Coil Matters More Than the Break
A tight box that has been building for many bars represents real agreement about price, agreement that is about to be tested. A wide, sloppy box represents disagreement, and a break out of a sloppy box is much more likely to fail. I want the tight ones. The box tells me which is which before I risk anything on the break.
How I Confirm It
A box break on its own is not enough. I want the break to happen on volume above the 50 period volume SMA. Breaks on thin volume are the ones that snap back inside the box within a bar or two, and requiring volume above average filters out most of them before they cost me anything.
I also want the higher timeframe EMA 34 on my side. If I am looking for a long break and the higher timeframe EMA 34 is pointed down, I let it go. The box tells me where, the higher timeframe trend tells me whether I should care.
Where the Stop and Target Go
Once the break confirms, the stop goes at the previous bar open, not a percentage and not a guess, a level the chart already gave me. TP1 sits at 1R, where I take partial size off. TP2 sits at 3R, where the rest of the position gets the room to run if the move keeps going.
This is the same structure I use on every setup, not just box breaks. A defined invalidation point before entry is what makes a stop a plan instead of a reaction.
A Real Example: SPY, September 2026
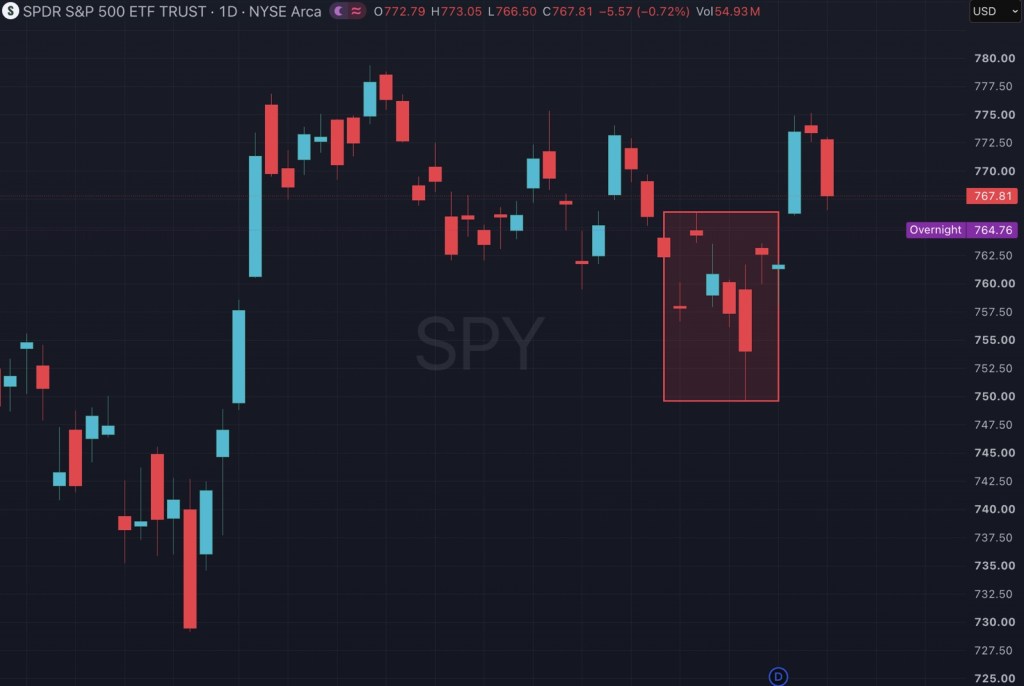
Here is what that looks like on a real chart. From September 9 through September 18, SPY spent eight sessions inside a box between $749.60 and $766.38. The lowest point in that stretch was a single wick to $749.60 on September 16, and even that day closed back at $754.05.
On September 21, SPY opened at $766.25, right at the top of the box, and closed at $773.50, well clear of it. Volume that day was 50.5 million shares against a 50 day average of about 44.0 million. That is the confirmation I want: a close outside the box, on volume above the average.
The levels write themselves from there. The previous bar opened at $761.31, so that is the stop. Measured from the $773.50 close, that is $12.19 of risk, which puts TP1 at $785.69 and TP2 at $810.07. I did not pick any of those numbers. The chart handed me every one of them.
What This Is Not
A box break is not an entry by itself and this is not a complete trading system on its own. It is one piece of how I read a chart. Eaglizer Precision plots the boxes, the higher timeframe EMA 34, the volume filter, and the dual RSI moving averages I use to confirm momentum, together on one chart, with the stop and target rules built into the plots so I am not doing that math by hand every time.
If you want to see the momentum side of this first, the free Eaglizer RSI Cloud is on my TradingView profile. If you want the full box and trend system, Eaglizer Precision is $79 on Gumroad.
Disclaimer
This is a technical analysis approach for education and research. It is not financial advice, it is not a recommendation to buy or sell anything, and past behavior of any setup does not predict future results. The SPY example above shows how the levels are measured, not a trade I am telling you to take. Trading involves risk of loss. Size your positions accordingly and do your own work.
Ready to see the full system these rules come from?


Leave a Reply