TECHNICAL ANALYSIS
The EMA 34 and EMA 89 Trend Filter: How I Know a Pullback Is Still a Trend
One moving average lies to you sometimes. Two, stacked the right way, tell you the truth.
A single moving average will whipsaw you. Price dips below it on a normal pullback, the line looks broken, and you close a position that was never actually in trouble. I stopped trusting any one line a long time ago. What I trust is two EMAs, moving at different speeds, that both have to agree before I call a trend intact.
Two Speeds, One Filter
The EMA 34 and the EMA 89 are both Fibonacci numbers, and I use them for different jobs. The EMA 34 is the faster of the two. It hugs price closely and reacts within days when momentum shifts. The EMA 89 is slower and smoother, a higher timeframe anchor that filters out exactly the kind of noise that makes a single fast EMA unreliable on its own.
Used together, the rule is simple. As long as price holds above both, the trend is still intact and I keep looking for long entries. The moment price closes below the EMA 89, the filter fails, regardless of how good any individual setup looks. I do not override this with an opinion about where price should go next.
Why the Slow One Matters More Than It Looks Like It Should
The EMA 34 alone gets touched constantly. Every normal pullback in a healthy trend dips into it or through it for a bar or two. If I exited every time price crossed the EMA 34, I would be trading in and out of the same trend a dozen times, paying for noise. The EMA 89 is what tells me whether a pullback into the EMA 34 is healthy or whether the trend itself is actually changing. A trend that is still working holds the EMA 89. A trend that is breaking does not.
A Real Example: SPY, June 2026
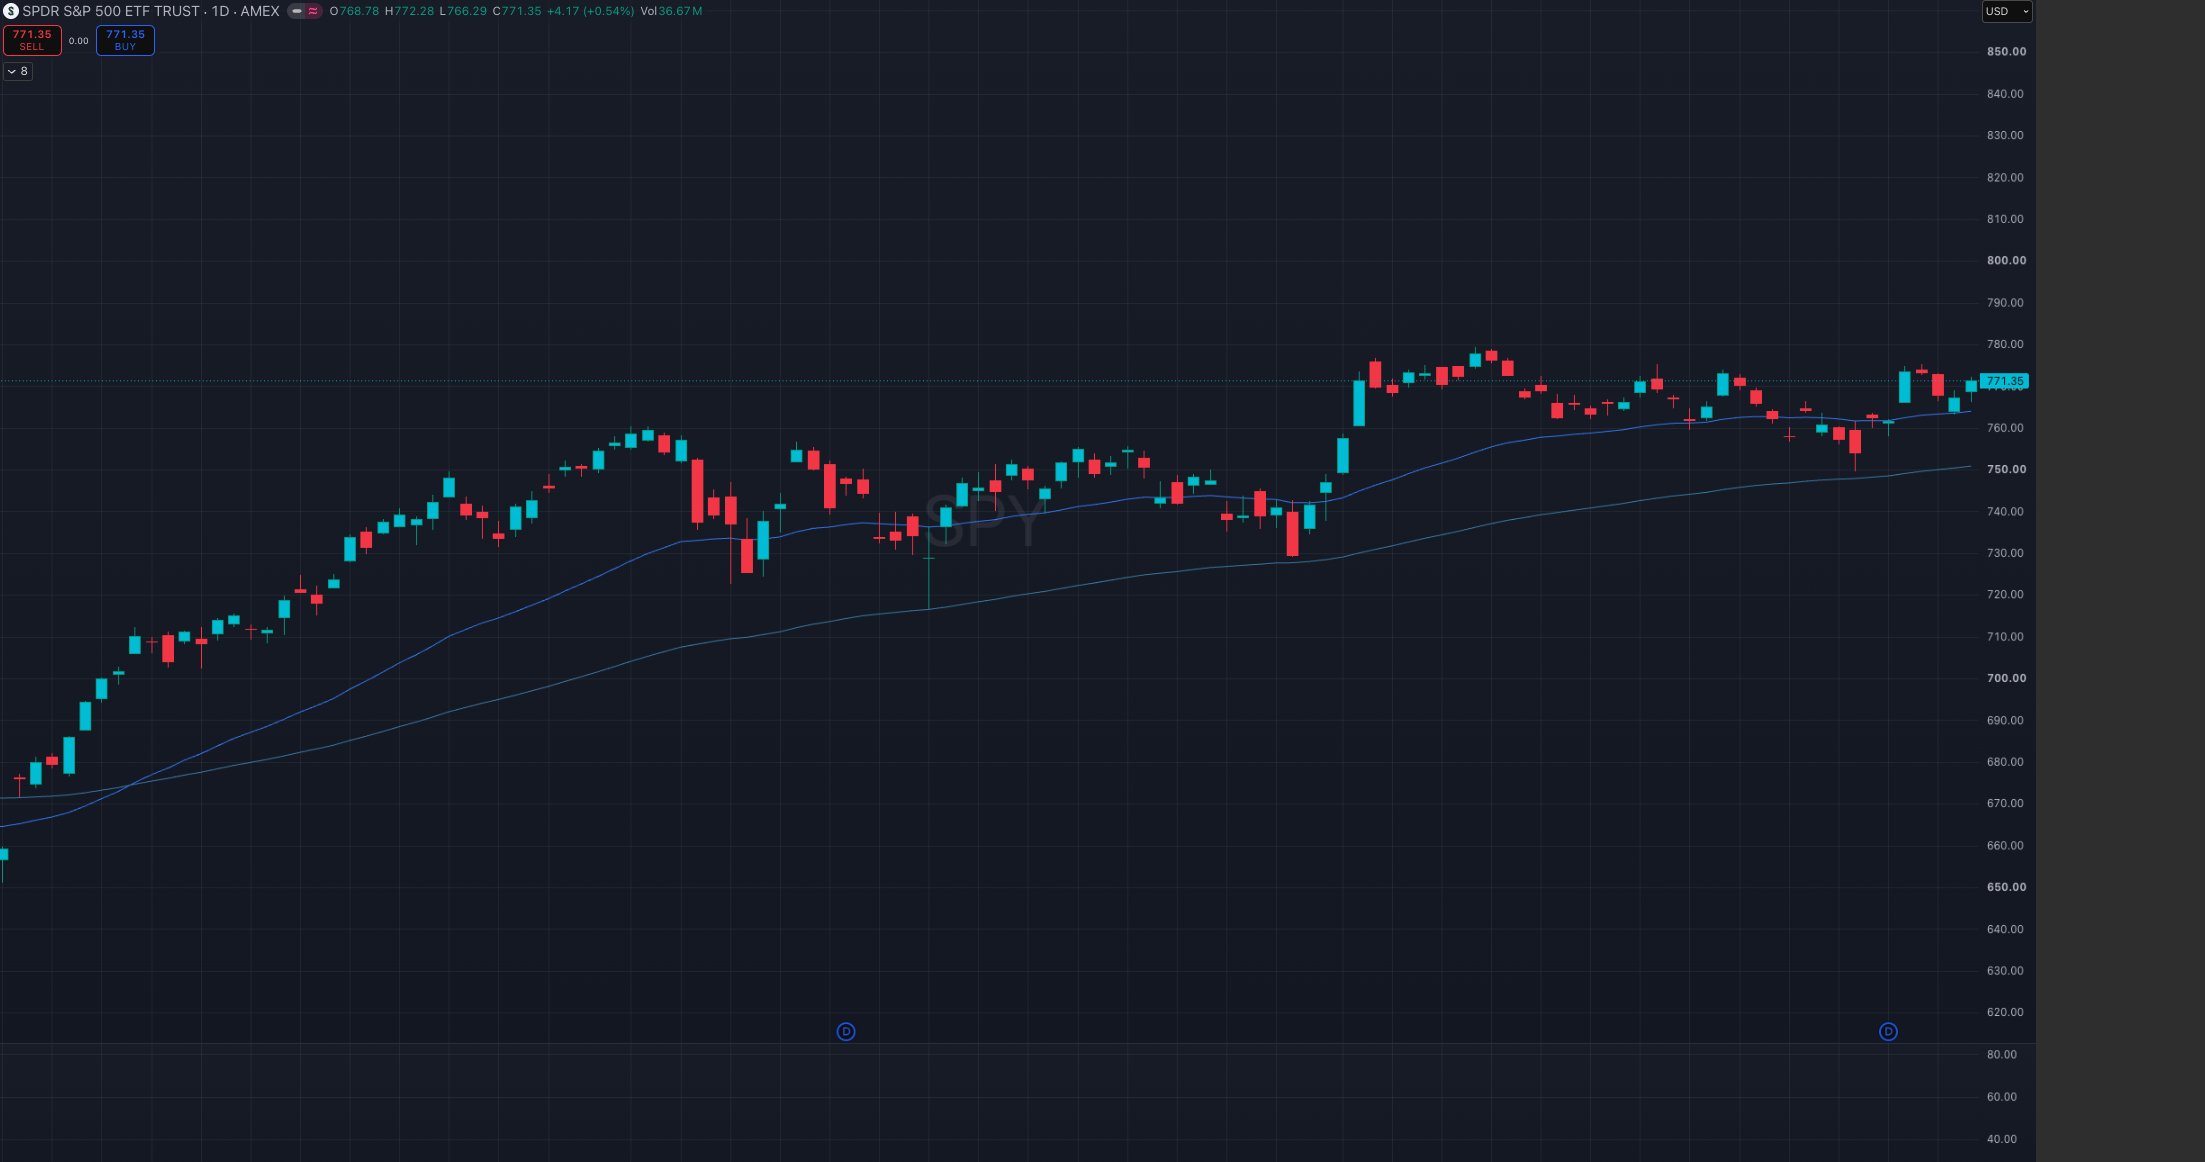
SPY rallied from a low of $656.65 on April 7, 2026 into the $750s by early June, a strong and fairly uninterrupted move. Then it dropped hard. On June 9 it fell to a low of $722.59, and on June 10 it fell again to $725.33 before closing at $725.43. That is a real decline, roughly 3.5 percent in two sessions off the recent highs, and it is exactly the kind of drop that shakes traders out of a position they should have held.
Both lows landed almost exactly on the EMA 89, visible on the chart as the slower of the two lines tracking just under the wicks of those two candles. Price never closed below it. On June 11, SPY opened at $728.76, ranged as low as $724.405, then reversed to close at $737.76, a wide bullish range on the same day the trend filter was being tested. By June 15 it closed at $754.83. By September 25 it closed at $771.35, up more than 17 percent from the April low.
Nothing about the June pullback looked comfortable while it was happening. A trader watching only price, or only a single fast moving average, had every reason to think the rally was over. The EMA 89 said otherwise, and it held.
What This Filter Does Not Do
It does not predict the pullback before it happens, and it does not tell you the low is in on the day it happens. It only tells you, after the fact and without emotion, whether the trend you were already in is still the trend you are in. That is a narrower job than most traders want from an indicator, and it is exactly why it works. I am not trying to call tops and bottoms. I am trying to stay in trades I already have a reason to be in, and get out cleanly when the reason stops being true.
Where This Fits in Eaglizer Precision
This is one of four pieces Eaglizer Precision plots together: the EMA 34 and EMA 89 trend filter, pivot breakout boxes, the volume filter, and the dual RSI moving averages. None of them are meant to work alone. The trend filter tells me whether I am allowed to look for a long at all. The other three tell me where and when.
Disclaimer
This is a technical analysis approach for education and research. It is not financial advice, it is not a recommendation to buy or sell anything, and past behavior of any setup does not predict future results. The SPY example above shows how the filter is read, not a trade I am telling you to take. Trading involves risk of loss. Size your positions accordingly and do your own work.
Ready to see the full system this filter comes from?


Leave a comment