Most breakouts fail. Price pokes above a level, traders pile in, and two days later it is back inside the range with everyone’s stops getting hit. I got caught by that over and over until I added one rule to every breakout I take: the breakout bar has to come with real volume behind it.
The rule is simple. I compare the volume on the breakout bar to the average volume of the last 50 bars. If the breakout bar is above that average, somebody with size is behind the move. If it is below, the move is running on fumes and I pass.
A Real Example: SPY, Summer 2026
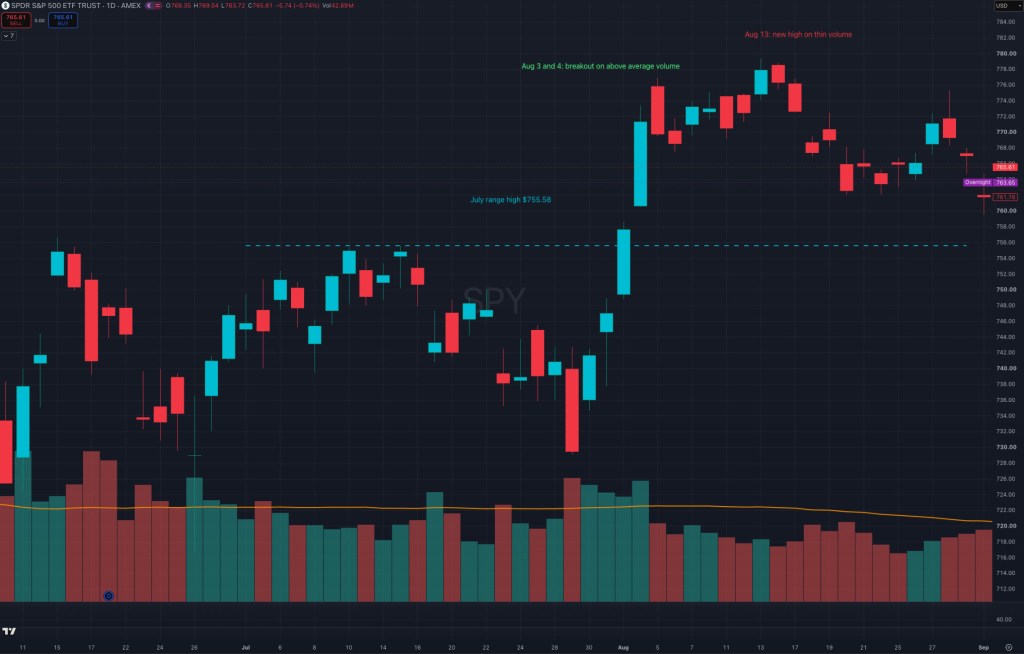
This chart has both sides of the lesson in the same month.
Through July, SPY chopped in a range and kept stalling just under $755.58. On August 3 it closed at $757.67, above the range, on about 59.9 million shares. That was already above the 50 period average of roughly 54.6 million. The next day it followed through to $771.33 on 69.2 million shares, about 1.27 times the average. That is what a real breakout looks like: price clears the level and volume shows up to confirm it.
Now look at August 13. SPY printed a new high at $779.37, which on price alone looks bullish. But volume that day was only 35.6 million shares, about two thirds of the 50 period average. Nobody was pushing. Within a week SPY was back down near $762, and it spent the rest of the month going sideways.
Same stock, same month, same kind of candle. The only difference was volume, and volume told you which one to trust.
Why 50 Periods
A short average, like 10 or 20 bars, jumps around too much. One busy week and the bar for “above average” moves with it, so almost anything qualifies. A very long average, like 200 bars, is slow to adjust when a stock’s normal volume changes after earnings or a big news cycle.
Fifty bars is about two and a half months on a daily chart. It is long enough to represent what normal really looks like for that stock, and short enough to adapt when normal changes. On lower timeframes the same logic holds: 50 bars of the chart you are trading.
How the Filter Fits Into a Trade
The volume filter is a gate, not a signal. It never tells me to buy. It only tells me whether a breakout I already like is allowed. Here is the order I check things:
- Trend. Is the higher timeframe trend on my side? I use the EMA 34 and EMA 89 for this, which I explained in The EMA 34 and EMA 89 Trend Filter.
- Level. Is price breaking a real range, not just a random candle high? That is what my pivot boxes mark, covered in Pivot Breakout Boxes.
- Momentum. Is RSI confirming? See RSI Explained.
- Volume. Is the breakout bar above its 50 period volume average? If not, no trade.
If all four line up, the risk rules take over. My stop goes at the open of the previous bar. My first target is 1R, the same distance as my risk. My second target is 3R.
Using the August 3 close of $757.67 as an illustration, the previous bar opened at $744.68. That is $12.99 of risk per share, which puts the first target at $770.66 and the second at $796.64. SPY traded up to $773.41 the very next day, so the first target was reached, and the stop was never touched through the chop that followed. The volume filter is what put that trade on the table in the first place, and what kept me away from chasing the August 13 high.
Common Mistakes With Volume
- Judging volume by eye. A bar can look tall next to its neighbors and still be below average. Put the 50 period line on the chart and let it decide.
- Ignoring holiday and half day sessions. Thin sessions are thin for everyone. A breakout on a half day tells you very little either way.
- Using volume as a reason to buy. A huge volume bar in the middle of a range is not a breakout. The level comes first, volume confirms it.
- Forgetting the follow through. The best breakouts often get a second above average bar right after the first, like SPY did on August 4. A breakout that immediately goes quiet deserves a tighter watch.
The Bottom Line
Price tells you where the market went. Volume tells you whether anyone meant it. A 50 period volume average is the simplest way I know to put a number on that, and it has kept me out of more bad breakouts than any other rule I use.
This filter is built into Eaglizer Precision, so the breakout, the volume check, the stop, and both targets are all on the chart at once.
Risk disclaimer: this post is for education only and is not financial advice. The SPY example is a historical illustration, not a recommendation. Trading involves substantial risk of loss, and past results do not guarantee future results. Only trade with money you can afford to lose.
NEXT STEP
Ready to trade with precision?
I built Eaglizer Precision, a TradingView indicator system with pivot boxes, EMA trend filters, a volume filter, and defined stop and target rules. Start with the free Eaglizer RSI Cloud on TradingView.


Leave a comment