
All Courses / Technical Analysis
Support and Resistance Levels
One of the most fundamental concepts in technical analysis. Learn how to identify price floors and ceilings, and how to trade them with precision.
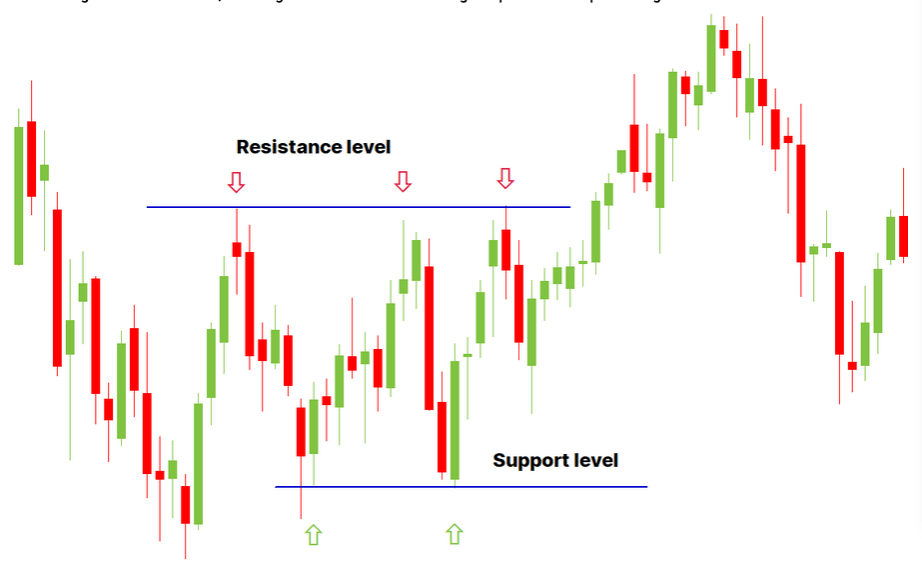
Support and resistance levels are critical concepts in technical analysis. Support represents a price level where an asset finds buying interest, preventing it from falling further. Resistance is a level where selling interest emerges, capping price gains.
Support: A Price Safety Net
Imagine a bouncing ball, every time it falls, it bounces back at a certain point. That bouncing point is like a support level. When prices approach this level, there’s a safety net in place. Historical evidence shows buyers are willing to step in and push prices higher at that level.
Resistance: The Price Barrier
Resistance acts as a ceiling. When prices approach a resistance level, sellers tend to dominate and push prices lower. Traders use resistance levels as potential selling opportunities.
Types of Support and Resistance
1. Horizontal Support and Resistance
Occurs when a price level consistently acts as a floor or ceiling. If a stock consistently finds buyers at $50, that becomes horizontal support. If it consistently struggles to break $70, that’s horizontal resistance.
2. Dynamic Support and Resistance (Moving Averages)
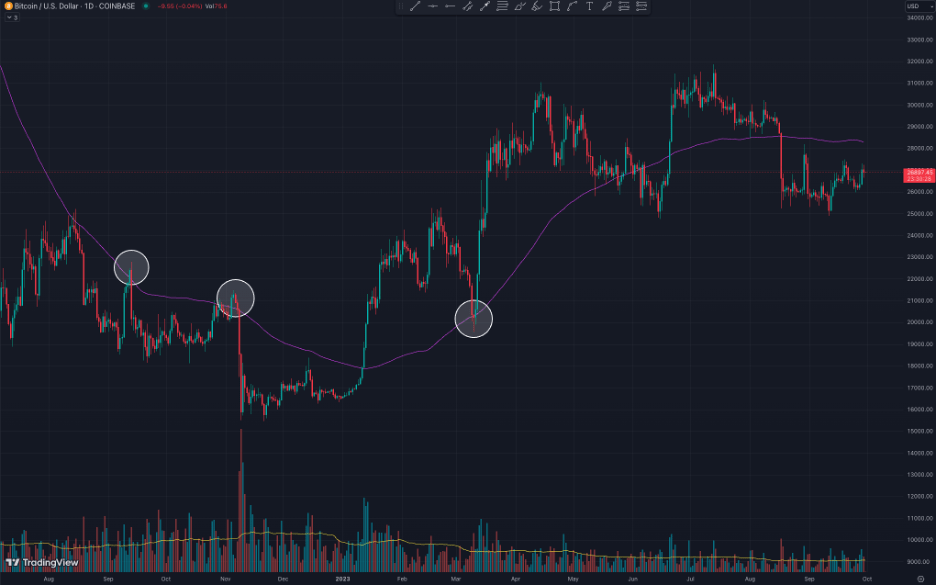
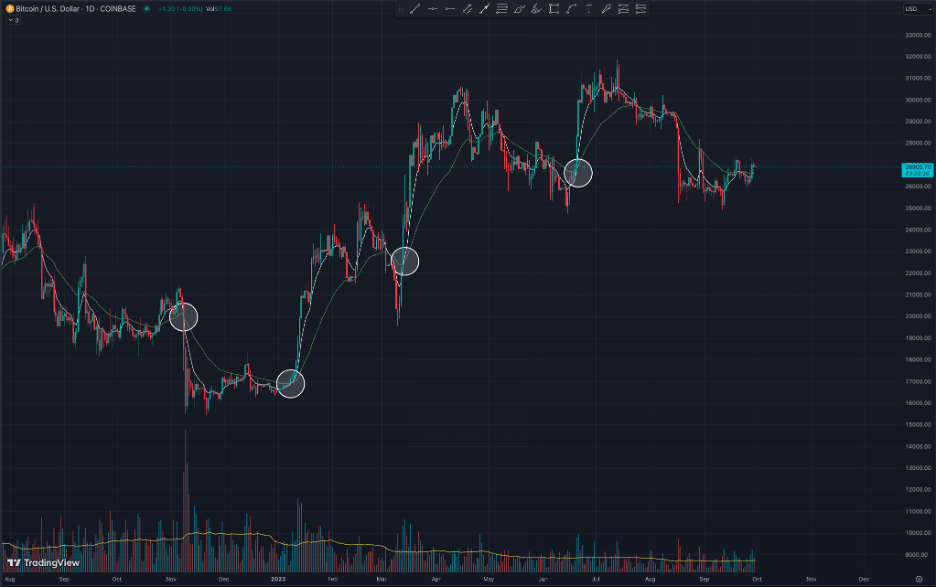
Moving averages change over time. A stock’s price consistently staying above the 50 day MA means that average acts as dynamic support. When a short term MA crosses above a long term MA, it’s a bullish signal, the Eaglizer EMA 8/34 crossover works on this principle.
3. Psychological Support and Resistance
Round numbers like $100, $500, or $50,000 (BTC) often act as psychological levels. All time highs and all time lows carry the same weight. Traders globally watch these levels simultaneously, which creates self fulfilling reactions.
4. Diagonal Support and Resistance (Trendlines)
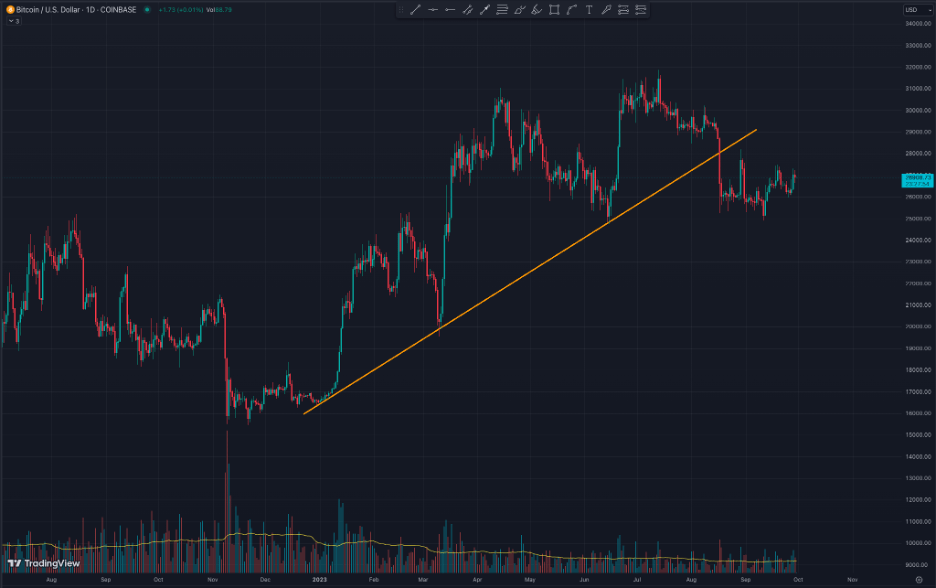
Diagonal trendlines follow the direction of price movement. An ascending trendline connecting higher lows acts as diagonal support. A descending trendline connecting lower highs acts as diagonal resistance.
5. Fibonacci Retracement Levels
Derived from the Fibonacci sequence (38.2%, 50%, 61.8%). These levels identify potential support or resistance within a price trend. The Eaglizer system uses Fibonacci based EMA periods (8, 34, 89, 144, 233) for the same reason, these numbers have natural market resonance.

Support and resistance levels are fundamental to every trade in the Eaglizer system. They define where you enter, where you place your stop loss, and where you take profit. Mastering them is non negotiable.
Ready to learn the full system?
Support and resistance is just one piece. The Eaglizer system combines it with EMA stacks and RSI confirmation for a complete edge in stocks and crypto.

