
All Courses / Technical Analysis
The Language of Candlesticks
Candlesticks are the language of the market. Every chart you will ever analyze is written in them. Learn to read them fluently.
Candlestick patterns are one of the fundamental tools in technical analysis. They are visual representations of price movements in a specific time period and provide traders with valuable information about market sentiment and potential price reversals.
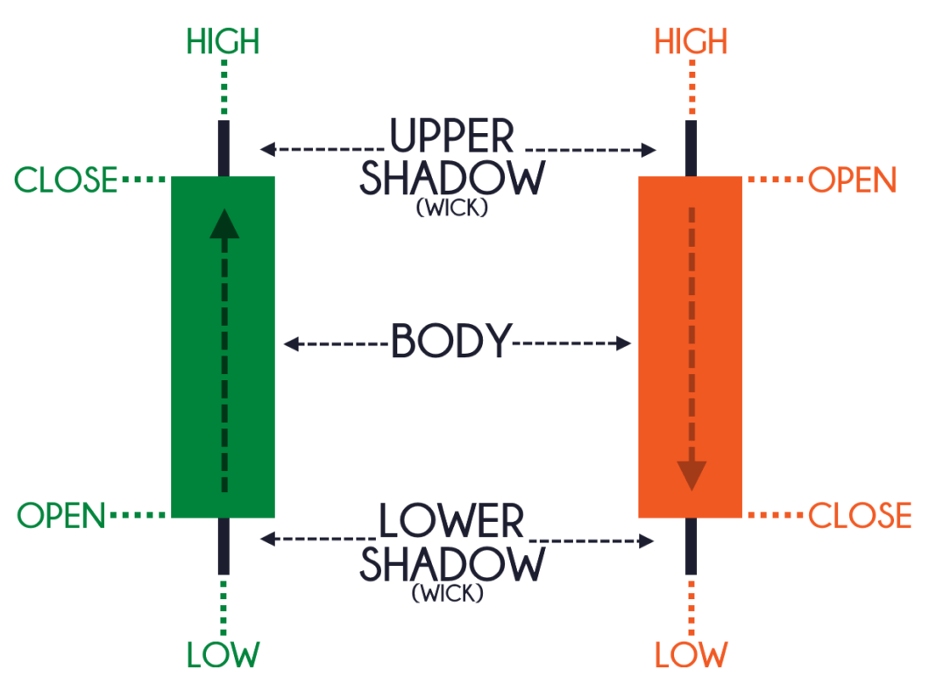
Anatomy of a Candlestick
OPEN
The price at which the asset starts trading at the beginning of the time period.
CLOSE
The price at which the asset ended trading. The body shows the range between open and close.
HIGH / LOW
The wicks (shadows) above and below show the highest and lowest prices reached during the period.
Bullish Patterns
Bullish candlestick patterns suggest a potential price increase, a shift from bearish to bullish sentiment.
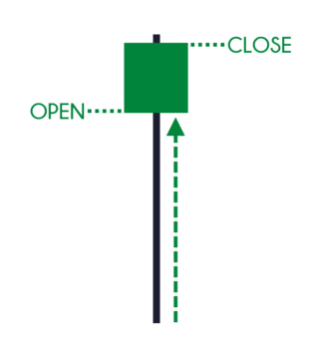
Hammer: Small body, long lower wick, short upper wick. Buyers rejected lower prices. Bullish signal at support. Bullish Engulfing: A small bearish candle followed by a larger bullish candle that engulfs it, sentiment shifting bullish. Morning Star: Three candles: bearish, doji, bullish. Potential reversal from downtrend to uptrend.


Bearish Patterns
Bearish patterns suggest a potential price decrease, a shift from bullish to bearish sentiment.

Shooting Star: Small body, long upper wick, short lower wick. Sellers rejected higher prices. Bearish signal at resistance. Bearish Engulfing: A small bullish candle followed by a larger bearish candle. Sentiment shifting bearish. Evening Star: Three candles: bullish, doji, bearish. Potential reversal from uptrend to downtrend.


Understanding candlestick patterns is essential for technical analysis. They provide valuable insights into market trends and potential trading opportunities, and they become even more powerful when combined with key support and resistance levels.
Ready to go deeper?
Candlesticks are just the beginning. The Eaglizer system layers EMA stacks and RSI confirmation on top of them for a complete, rules based trading approach.

