
All Courses / Technical Analysis
Understanding Volume
Price tells you what is happening. Volume tells you how much conviction is behind it. A move without volume is noise. A move with volume is signal.
Trading volume is the total number of shares, contracts, or units of an asset traded within a specific time frame. It reflects the level of interest and activity in a particular asset. High volume means many participants active. Low volume means few participants, less reliable moves.
Why Volume Matters
MARKET ACTIVITY
High volume signals many active participants and strong liquidity. Low volume means fewer participants, lower confidence in the move.
TREND CONFIRMATION
A healthy uptrend has higher volume on up days, lower on down days. Rising volume on a breakout means conviction. Low volume breakouts frequently fail.
REVERSAL SIGNALS
Extreme volume spikes can signal potential trend reversals. A surge in volume after a prolonged downtrend may indicate a market bottom forming.
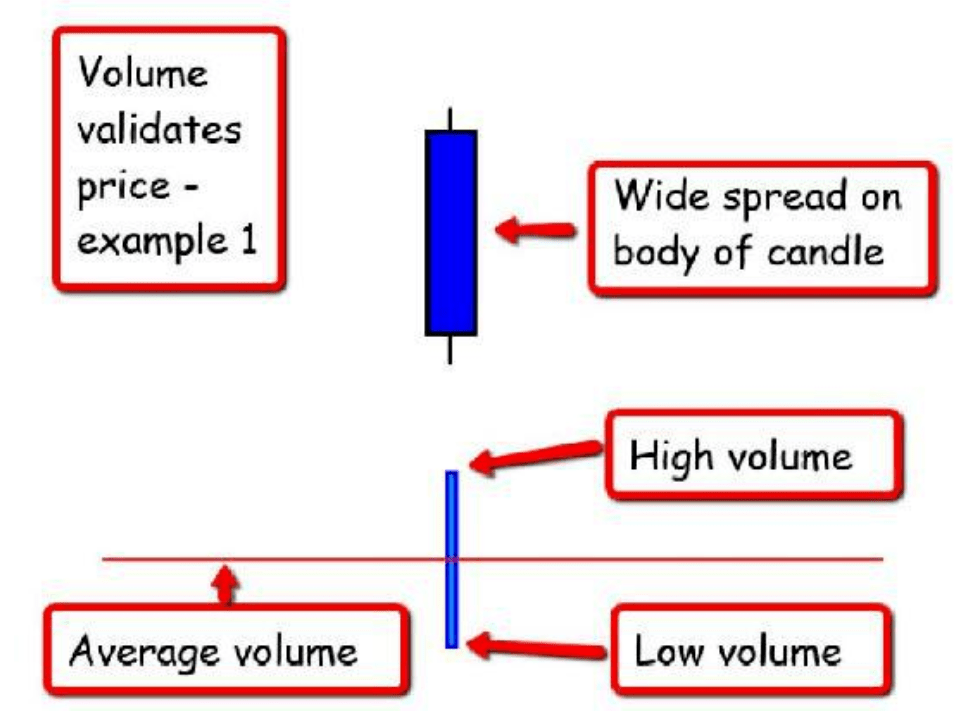
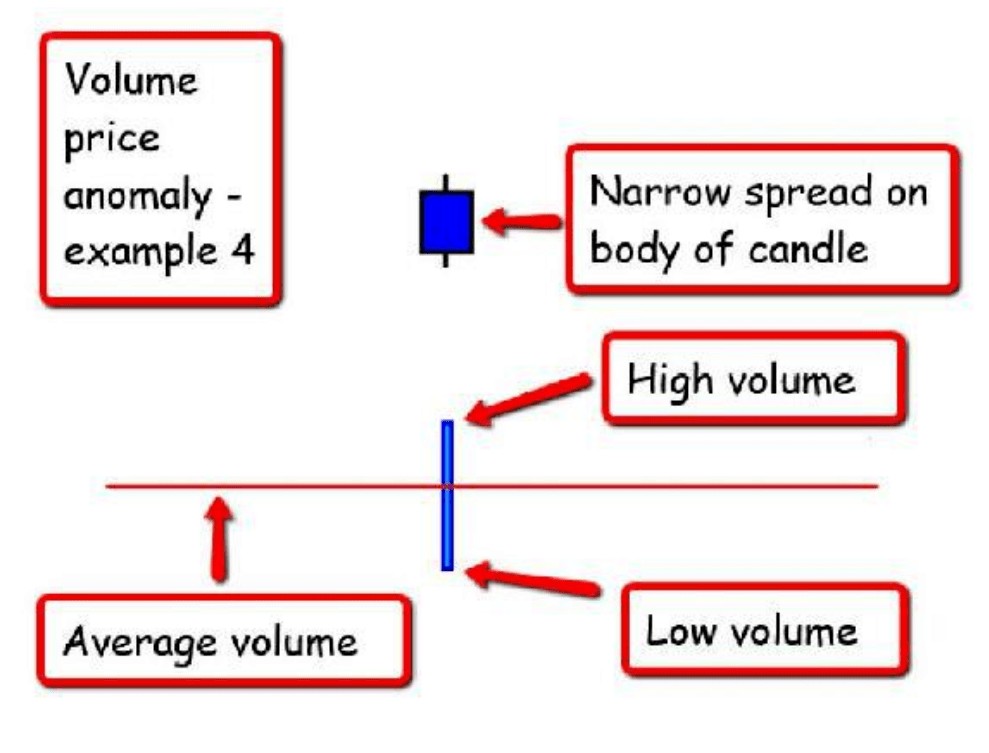
The EagleVision Cycle
The EagleVision Cycle maps the four phases of a market cycle and how volume behaves in each one. Understanding this cycle helps you identify where you are in the market and what comes next.
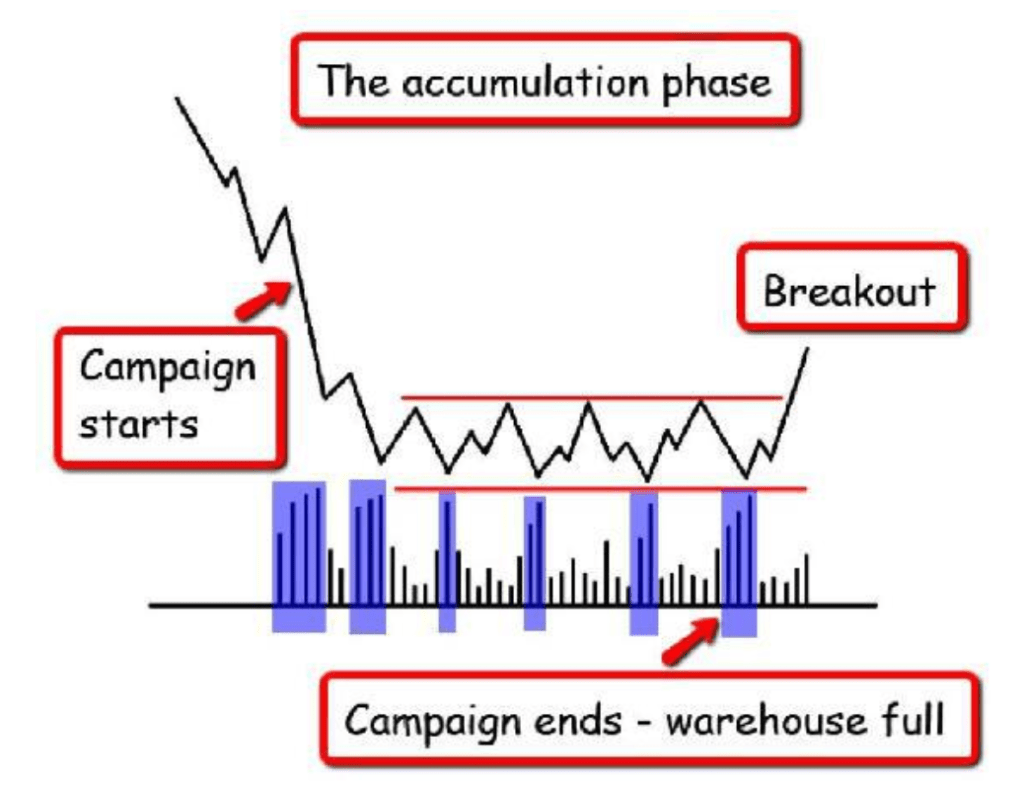
Phase 1: Nesting (Accumulation)
Prices hover in a range. Institutions quietly accumulate. Volume gradually increases as smart money builds positions. Low volatility, sideways action.
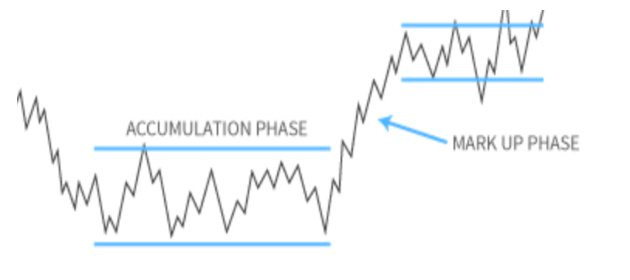
Phase 2: Soaring Uplift (Mark Up)
Demand lifts prices into a bullish ascent. Volume soars alongside price. Strong momentum. This is where trend following systems like the Eaglizer EMA crossover generate entries.
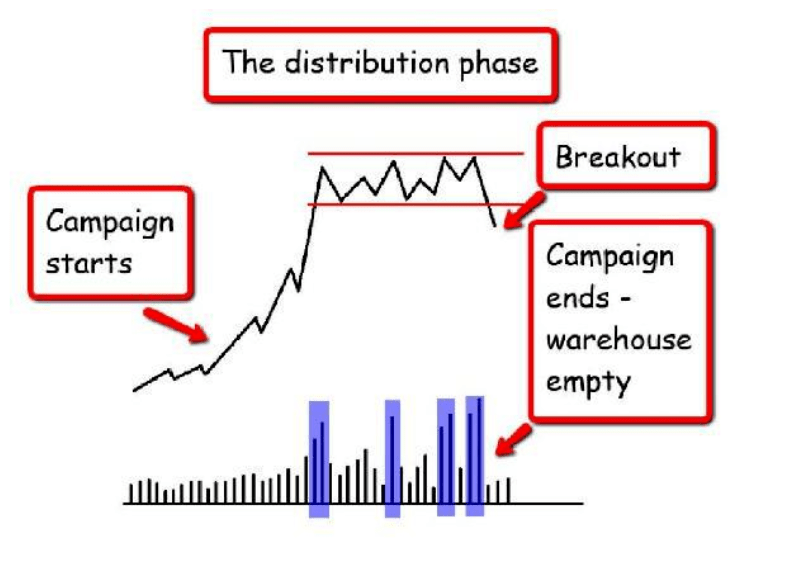
Phase 3: Windward Glide (Distribution)
Informed investors quietly exit. Prices drift sideways or slightly down. Volume rises during descending periods, a warning sign that supply is increasing.
Phase 4: Descending Thermal (Mark Down)
Selling pressure dominates. Prices decline with high volume. The Eaglizer system stays out of longs when price is below the SMA 99 and 200, this is exactly why.

Key Volume Indicators
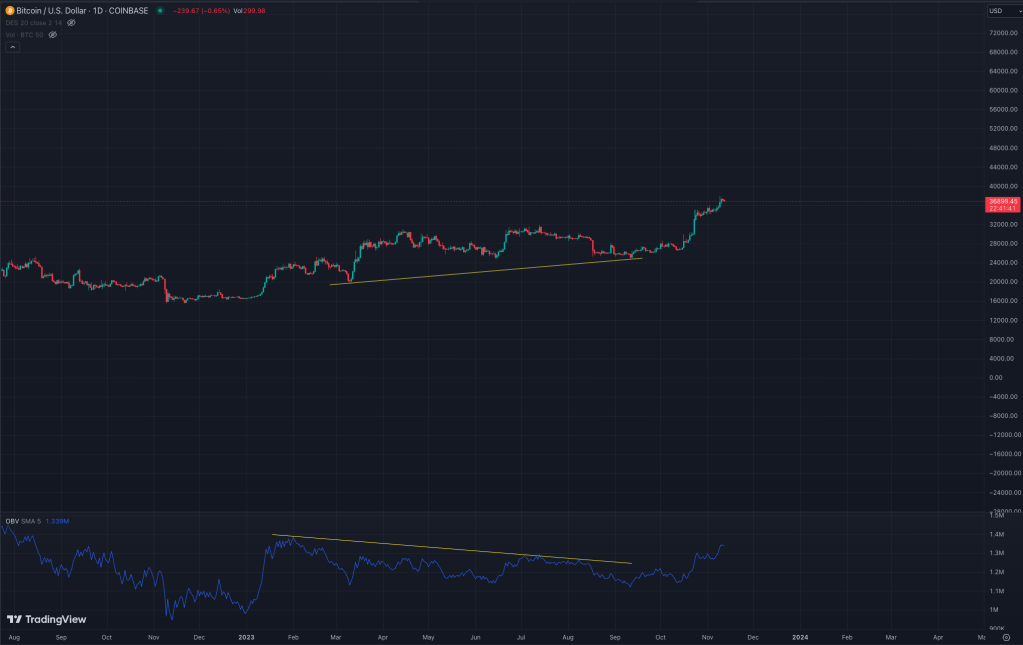
On Balance Volume (OBV)
Adds volume on days that close up and subtracts volume on days that close down. Helps identify trend strength and potential reversals. When OBV is rising while price is flat, accumulation may be occurring.
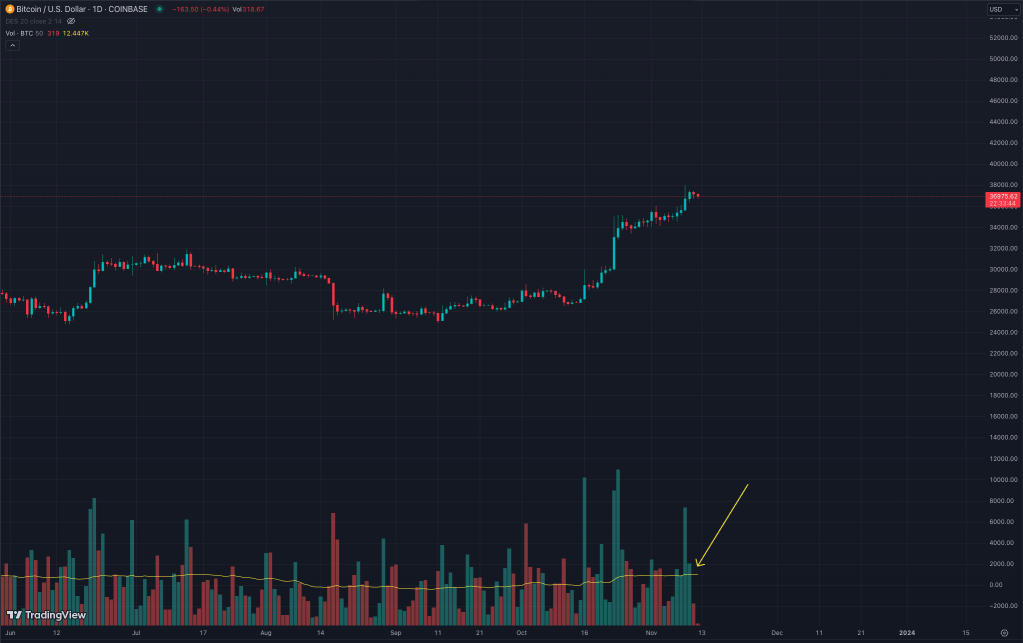
Volume Moving Averages
Smooth volume data to identify trends. The 50 period volume moving average is a useful baseline, when current volume exceeds it significantly, the move has above average participation.
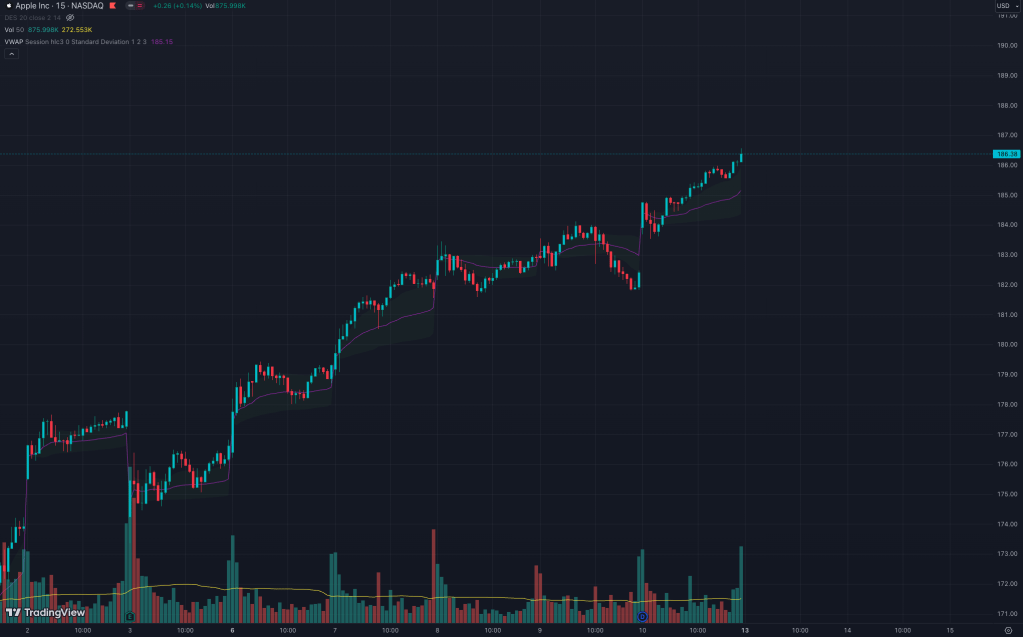
VWAP (Volume Weighted Average Price)
VWAP calculates the average price weighted by volume. Price above VWAP is bullish. Price below VWAP is bearish. It acts as dynamic intraday support and resistance, and is used by institutional traders for order execution.

Ready for the full system?
Volume analysis combined with EMA stacks and RSI confirmation is at the core of the Eaglizer approach. Get Eaglizer Precision to see it plotted automatically on your own chart.

