The Math, the Psychology, and the Edge Behind the Golden Ratio
Why Fibonacci Is More Than Just a Trading Tool
Before we talk about charts, let us talk about nature.
In the 13th century, an Italian mathematician named Leonardo Fibonacci introduced Europe to a number sequence that had already existed in nature for millions of years:
0, 1, 1, 2, 3, 5, 8, 13, 21, 34, 55, 89, 144…
Each number is the sum of the two before it. Simple. But what makes this sequence remarkable is what happens when you divide any number by the one that follows it. You always get approximately 0.618. Divide it by the number two places ahead and you get 0.382. These ratios appear everywhere in the natural world.

Look at the image above. The spiral of a nautilus shell. A galaxy rotating in deep space. The fractal pattern of a romanesco. A hurricane viewed from orbit. A fossilized ammonite. The seed arrangement of a sunflower. Six completely different things from completely different corners of existence. All governed by the same ratio.
This ratio — 0.618 — is called the Golden Ratio. And it is not a coincidence that it shows up in markets.
Markets are not made of algorithms. They are made of people. And people, consciously or not, are wired by the same mathematical patterns that govern everything in nature. Fear, greed, hesitation, confidence. These emotions do not move randomly. They move in patterns. And those patterns reflect the Golden Ratio more often than most traders realize.
That is the philosophy behind Fibonacci trading. It is not a magic formula. It is a recognition that human psychology is predictable, that markets breathe in and out at ratios that repeat across time, and that if you know where those levels are, you gain a real edge.
This is also why Fibonacci applies beyond trading. Humans naturally gravitate toward balance and proportion. A face is more attractive when its proportions align with 0.618. Architecture built around the Golden Ratio feels more comfortable. Music structured around these ratios sounds more resolved. The market is simply another expression of human nature — and human nature follows the same mathematical laws as everything else in the universe.
The Key Fibonacci Levels You Need to Know
When traders use Fibonacci retracements, they are measuring how far a market has pulled back after a significant move. The most important levels are:
23.6% — Shallow retracement. Seen in very strong trending markets. Price barely pauses before continuing.
38.2% — Moderate retracement. Common in healthy uptrends. Strong stocks often bounce here on the first pullback.
50% — Not technically a Fibonacci number, but widely watched. The midpoint of any move carries psychological weight because traders remember it.
61.8% — The Golden Ratio. The most important level. When price pulls back to the 61.8% zone and holds, that is one of the strongest signals in technical analysis.
78.6% — Deep retracement. Still valid in trending markets, but the move is being tested hard. If price breaks below this with conviction, the original trend is likely over.
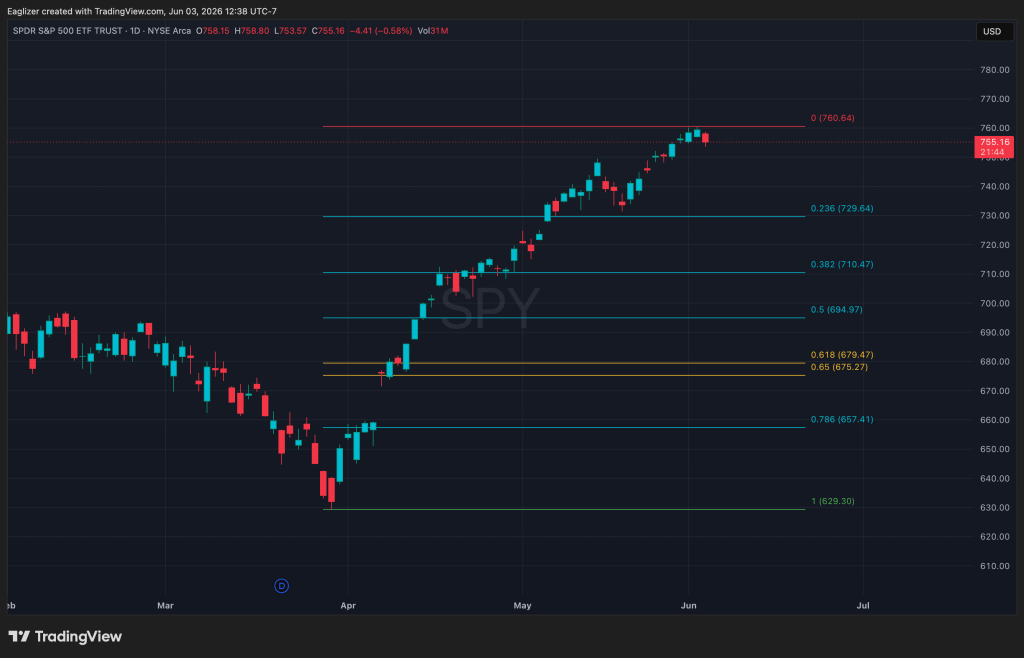
Look at the SPY chart above. The retracement is drawn from the April low of $629.30 up to the high of $760.64. Every key level is automatically plotted: the 23.6% at $729.64, the 38.2% at $710.47, the 50% at $694.97, and the Golden Ratio at $679.47. These are not random lines. They are the exact zones where buyers and sellers are most likely to make decisions.
How to Draw a Fibonacci Retracement
The tool is built into TradingView. Here is how to use it correctly.
In an uptrend:
- Identify the swing low — where the move started
- Identify the swing high — where the move peaked
- Drag the Fibonacci tool from the swing low up to the swing high
- The retracement levels are automatically drawn below the high
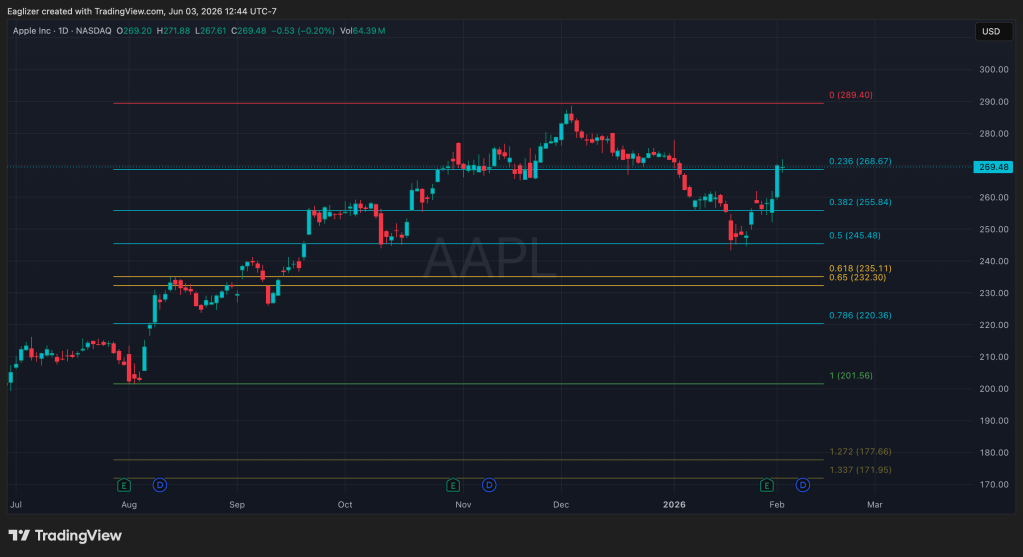
Look at the Apple chart. The retracement is drawn from the high of $289.40 down to the low of $201.56 — a significant downtrend move. The key levels are plotted above the low: 38.2% at $255.84, 50% at $245.48, and the Golden Ratio at $235.11. Notice how price respected the 50% level at $245.48 during the selloff before attempting a recovery toward the 38.2% at $255.84.
In a downtrend:
- Identify the swing high — where the move started
- Identify the swing low — where the move bottomed
- Drag from the swing high down to the swing low
- The levels are drawn above the low
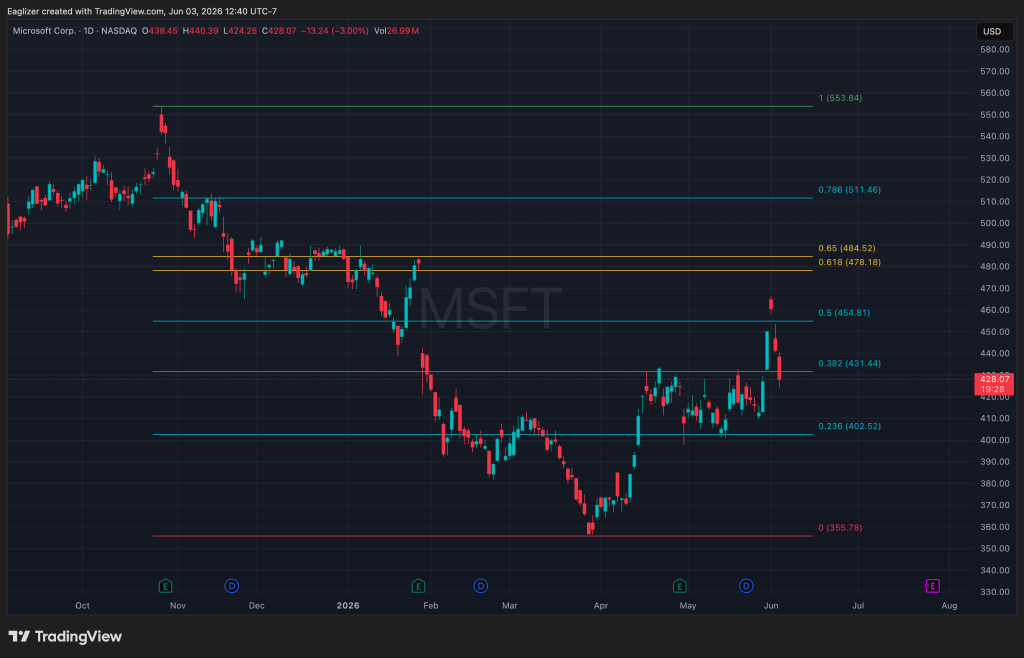
The Microsoft chart shows the same concept on a larger scale. Drawn from the high of $553.84 down to the low of $355.78, the 38.2% level sits at $431.44 and the 61.8% at $478.18. After bottoming, price began recovering and is now testing the 38.2% zone at $431.44 — exactly where you would expect resistance to appear on a bounce from a downtrend.
The key is always using significant swing points, not minor ones. You want to capture a meaningful move, not intraday noise.
Why These Levels Work: The Psychology Behind the Numbers
When millions of traders are watching the same asset, they are not watching randomly. They are watching the same levels. And no level in the history of markets has been watched more carefully than the 61.8% Golden Ratio.
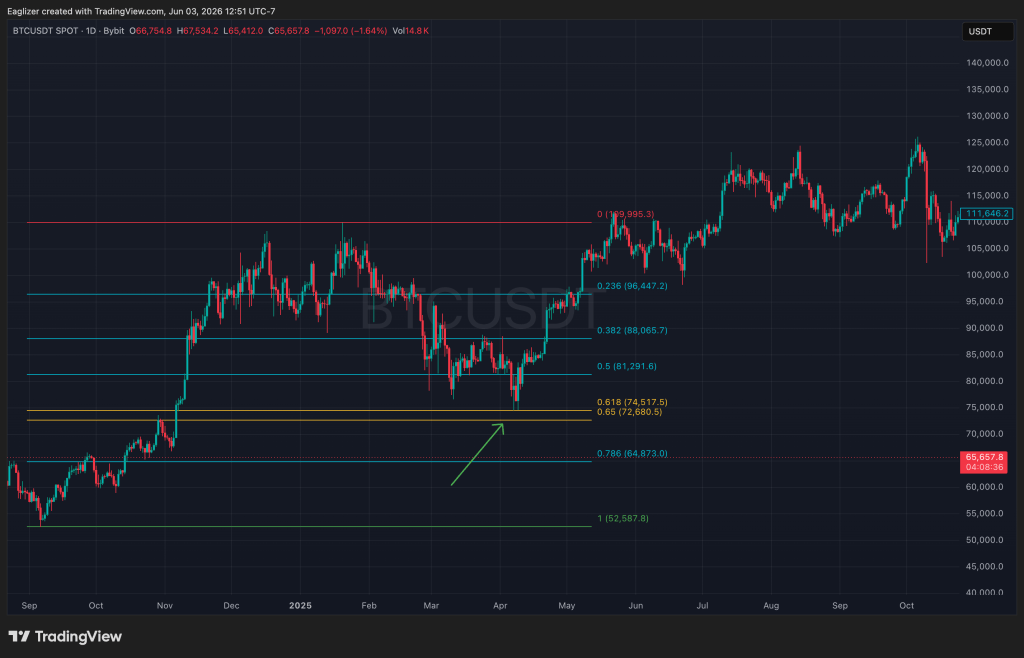
Look at the Bitcoin chart above. The Fibonacci retracement is drawn from the cycle low of $52,587 up to the high of $109,995. The 61.8% retracement sits at $74,517. Bitcoin pulled back from its high, found support right at the Golden Ratio, and launched into a new all-time high — eventually reaching over $125,000.
This is not luck. This is collective psychology in action. At $74,517, traders who had been waiting for a meaningful dip finally stepped in. Long-term holders who bought lower added to their positions. Institutions that missed the original run deployed capital. All of them were watching the same level. That concentrated buying is exactly what created the bounce.
The levels work because enough traders believe they work. And enough traders believe they work because they have watched them hold over and over again — across stocks, crypto, forex, and commodities. Bitcoin at $74,517. The ratio does not care what the asset is. It only cares about where human psychology creates inflection points.
This is a self-fulfilling dynamic rooted in something real: the natural tendency of human decision-making to cluster around proportional levels. The same way a hurricane spirals at the Golden Ratio. The same way a sunflower arranges its seeds. Markets breathe at these levels because people do.
Fibonacci EMA Stacks: Where It Gets Powerful
A single Fibonacci level is useful. A Fibonacci level that lines up with a key moving average is significantly more powerful.
Notice something about the Fibonacci sequence: 8 and 34 are both Fibonacci numbers. I use exponential moving averages set to exactly these values — the 8 EMA shown in white and the 34 EMA shown in green. This is not arbitrary. These moving averages carry Fibonacci proportionality built into them. Markets respect them for the same reason they respect Fibonacci retracement levels.
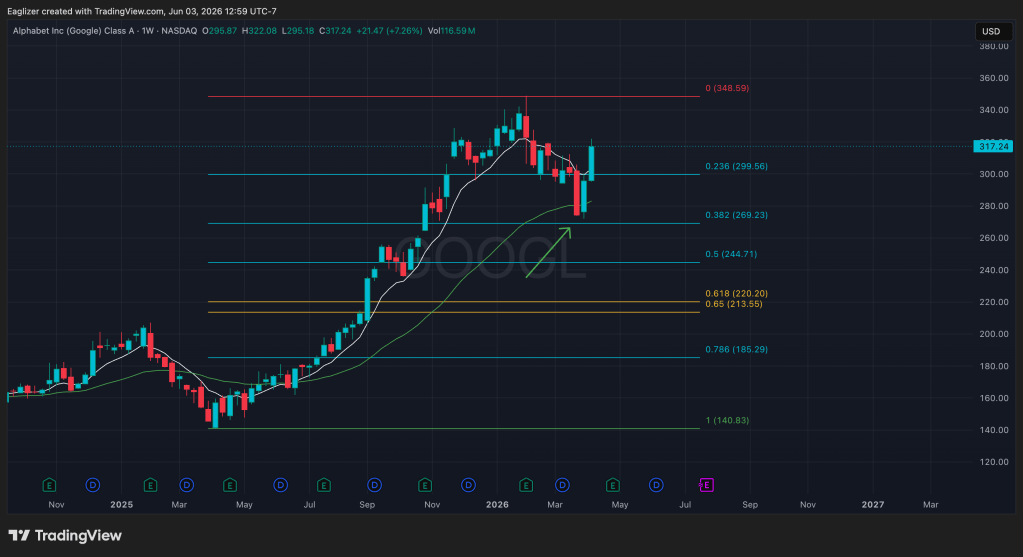
Look at the Google chart. The Fibonacci retracement is drawn from the low of $140.83 up to the high of $348.59. After topping out, price pulled back and found support right at the 38.2% level of $269.23 — precisely where the white 8 EMA and green 34 EMA were also converging. That is confluence. Two completely independent tools agreeing on the same zone. The green arrow shows what happened next: a powerful bounce and continuation higher. Price is now at $317.24 and pushing back toward the highs.
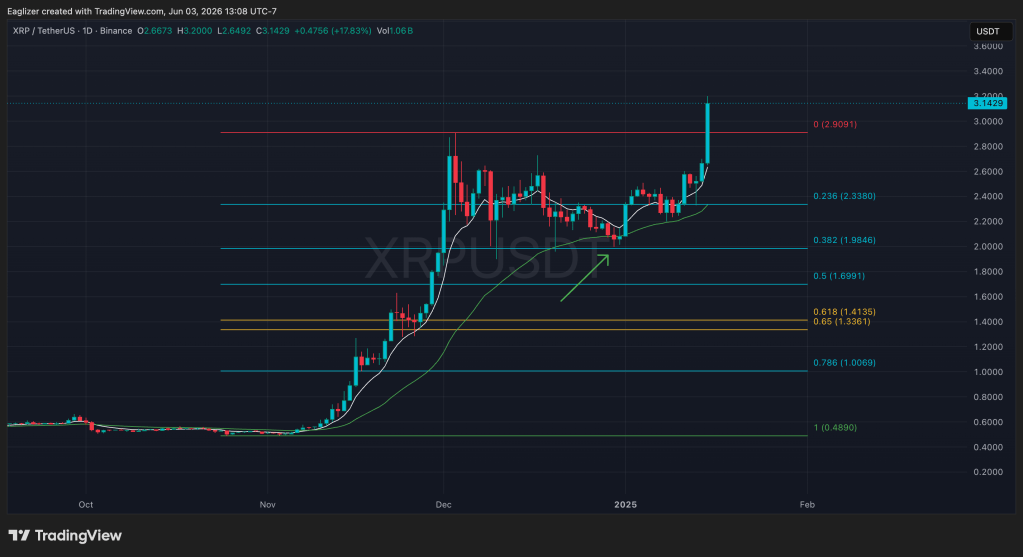
The XRP chart tells the same story. The retracement is drawn from $0.489 up to $2.909. After a major run, price pulled back and found the 38.2% level at $1.9846 — right where the EMAs were sitting. That zone held. XRP then launched from under $2 to over $3, a move of more than 50% from the Fibonacci support zone.
When price pulls back to a Fibonacci level and the 8 EMA and 34 EMA are in the same zone, that is where the high-probability trade lives. Multiple tools, multiple trader groups, all watching the same level at the same time.
How to Trade Fibonacci Levels: Step by Step
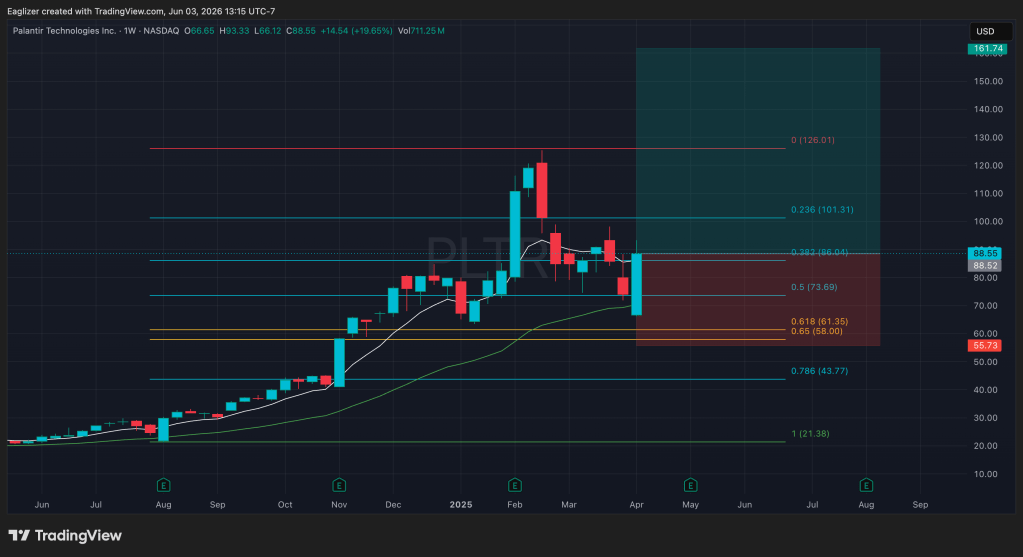
Palantir is one of the clearest examples of how Fibonacci and EMA confluence creates a tradeable setup. Look at the early chart. Price was basing between the 61.8% level at $61.35 and the 38.2% level at $86.04. The white 8 EMA and green 34 EMA were beginning to slope upward and price was coiling just above them. The setup was forming.
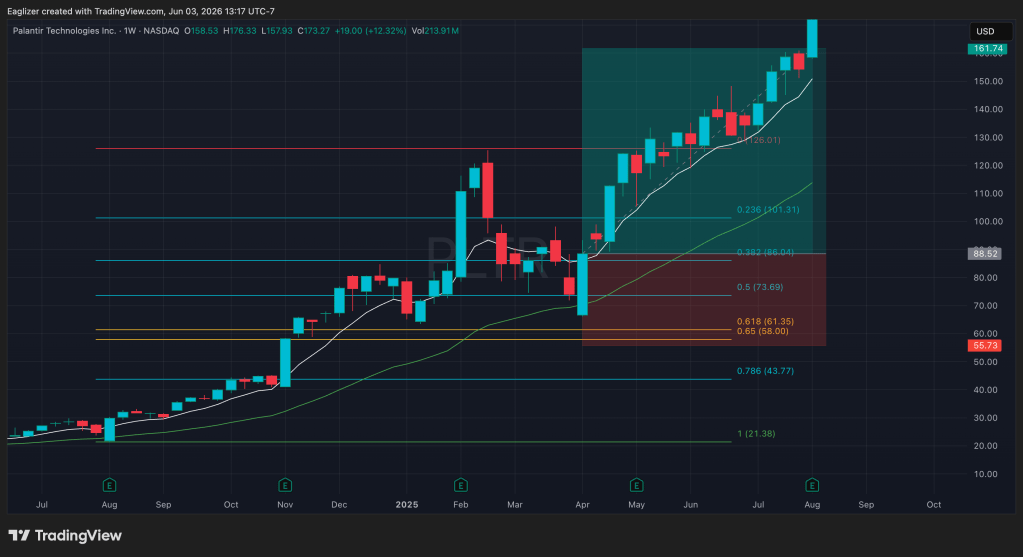
Then look at what happened on the second chart. Price broke above the 38.2% at $86.04, accelerated through the 23.6% at $101.31, blew past the prior high of $126.01, and ultimately reached over $176. The entire move was telegraphed by the Fibonacci structure and EMA alignment. Traders who understood the setup were positioned before the explosion.
Here is the step by step process:
Step 1: Identify the trend
Only trade Fibonacci retracements in the direction of the trend. In an uptrend, you are looking for pullbacks to buy. Price should be above your moving averages and the 8 EMA and 34 EMA should be sloping upward.
Step 2: Draw the retracement
Use a clear, significant swing. On PLTR, the swing was drawn from the low of $21.38 up to the high of $126.01. That gave you the key levels to watch: 38.2% at $86.04 and 61.8% at $61.35.
Step 3: Find confluence
Look for Fibonacci levels that line up with your 8 EMA (white) or 34 EMA (green). On PLTR, the 38.2% at $86.04 aligned with both EMAs — that was the zone to watch.
Step 4: Wait for confirmation
Do not buy the moment price touches a Fibonacci level. Wait for price to show you it is holding. A bullish candle closing above the level. Volume picking up on the bounce. On PLTR the confirmation was a strong weekly candle reclaiming the 38.2% and the EMAs turning back up.
Step 5: Place your stop
Your stop goes below the Fibonacci level you are trading. On the PLTR setup, a stop below the 38.2% at $86.04 defined the risk clearly. If price broke below with conviction, the setup was off.
Step 6: Set your targets
The first target is the previous high — the 0% level. On PLTR that was $126.01. For continuation trades, Fibonacci extensions at 127.2% and 161.8% are the next logical targets, which is exactly where PLTR went, ultimately reaching over $176.
Common Mistakes to Avoid
Drawing from the wrong points. Always use the most recent significant swing high and low. Using minor intraday swings produces unreliable levels.
Entering on the touch alone. Not every Fibonacci level holds. Wait for confluence and confirmation before committing.
Trading against the trend. Fibonacci is a retracement tool. Using it in the wrong direction is a low-probability approach, especially when starting out.
Placing the stop too tight. Give the level room to breathe. A stop placed exactly at the Fibonacci line often gets taken out by normal volatility before the trade works.
Putting It Together
The reason Fibonacci levels hold in markets is the same reason the Golden Ratio appears in the nautilus shell, the galaxy, the hurricane, and the sunflower. It reflects how patterns unfold when governed by proportion and balance.
Bitcoin at $74,517. Google at $269.23. XRP at $1.9846. Palantir holding the 38.2% at $86.04 before a move to over $176. These are not coincidences. They are the same mathematical law expressing itself through human decision-making.
When you understand this, Fibonacci stops being a tool you use mechanically and becomes a lens you see markets through. You stop guessing where a pullback will end and start watching for the natural resting points where the market is likely to breathe and continue.
Go to TradingView right now. Find a stock or crypto you follow. Identify a recent significant move. Draw the retracement. Then add the 8 EMA in white and the 34 EMA in green. Watch how often the Fibonacci levels and the EMAs cluster at the same zone. Do this on 10 charts. You will start seeing it immediately.
Want the exact entry rules, stop placement, and checklist I use to trade this system? The Trading Starter Pack includes the EMA Fibonacci Cheat Sheet, a Pre-Trade Setup Checklist, and a Position Size Calculator.
New to trading? Start with the free course first: Trading Foundations

Leave a comment