Eaglizer Strategy
Imagine the Eaglizer Strategy as a unique story set against the backdrop of the financial world, where traders are represented by majestic eagles. In this tale, the eagle embodies the spirit of traders, navigating the ever-changing currents of the market sky.
The 99-day Simple Moving Average (SMA) becomes the foundation, a distant mountain range that signifies the borders of market trends. Soaring above it, our eagle traders bask in the warmth of bullish sunshine, while dipping below, they navigate the shadows of potential bearish valleys.
Now, let’s focus on the eagle itself. As the market landscape is painted with emotions, the 8-day Exponential Moving Average (EMA) represents the turbulent winds of fear and greed. When our wise eagle takes a calculated dive, crossing the 34-day EMA, it symbolizes a momentous turn—a clash of emotions in the financial skies.
Amidst the vast expanse, the Eaglizer Strategy introduces a magical elixir, a secret sauce enriched with the wisdom of Fibonacci retracement and extension levels. Think of this as the eagle’s keen vision, allowing traders to spot hidden opportunities and navigate the emotional storms. Like the eagle, traders leverage Fibonacci to uncover the psychological cues of fear and greed, guiding them to set profit targets and navigate the uncharted territories of the market wilderness.
In this metaphorical narrative, success is not just about flight – it’s about the eagle’s mastery over fear and greed, soaring through the financial wilderness with the guidance of the Eaglizer Strategy. Traders, embark on this mythical journey, embrace the winds of emotions, and let the Eaglizer Strategy be your compass, where the eagle’s wisdom and the delicate balance of fear and greed create a story of triumph and mastery in the vast skies of the financial narrative.
Let’s dive straight into the Eaglizer Strategy without metaphorical elements:
99 SMA (Simple Moving Average):
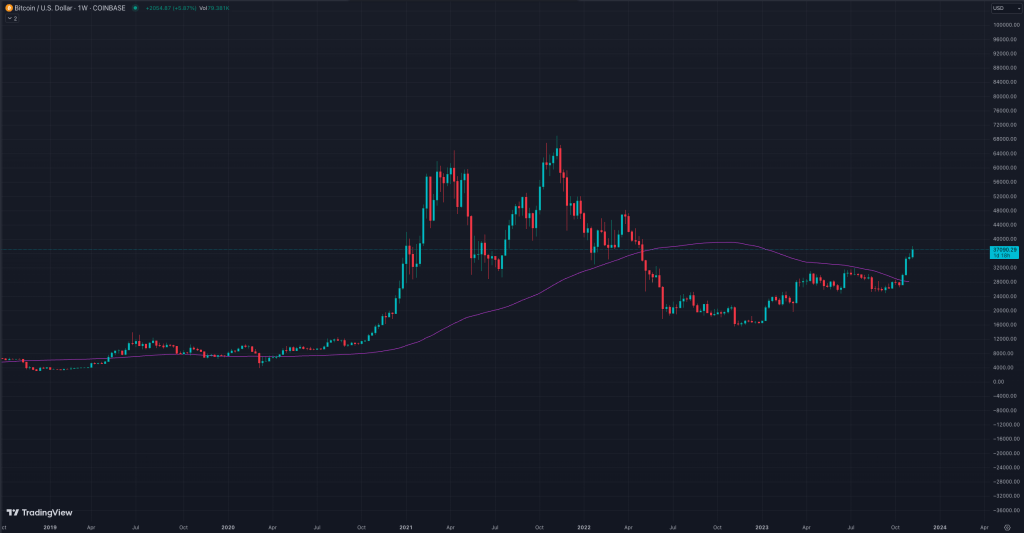
Role: Acts as a long-term trend filter.
Signal: Consider a long position when the price is above the 99 SMA, indicating a potential bullish trend. Conversely, think about a short position when the price is below, suggesting a potential bearish trend.
RSI (Relative Strength Index):
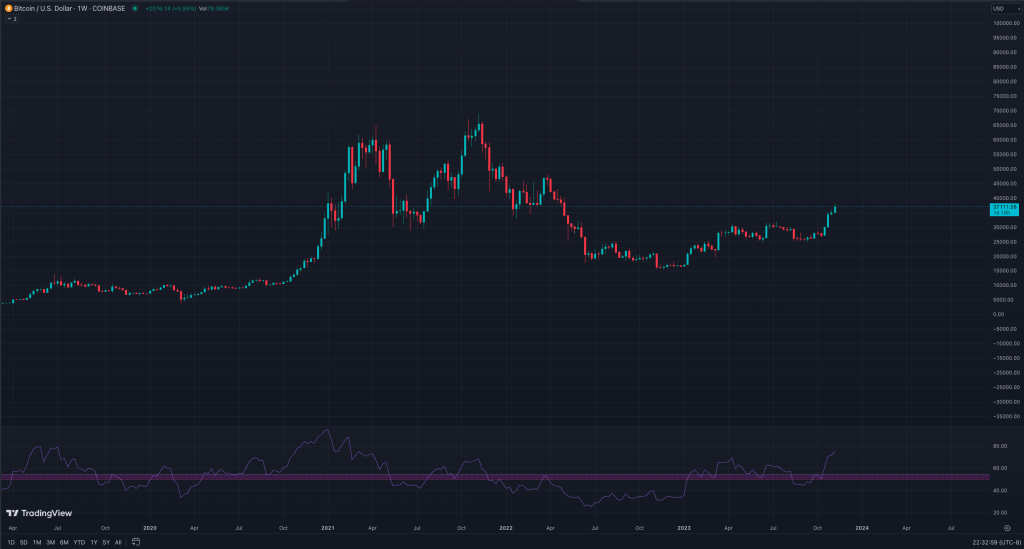
Role: Provides a momentum perspective.
Signal: Look for a long opportunity when RSI is above 55, signaling potential overbought conditions and bullish momentum. For a short play, watch for RSI below 50, indicating potential oversold conditions and bearish momentum.
8 EMA (Exponential Moving Average):

Role: The 8 EMA is designed to identify short-term momentum shifts.
Why 8? The number 8 is aligned with Fibonacci principles and is chosen to provide a more responsive view of recent price movements. It allows traders to quickly adapt to short-term market shifts and capture immediate momentum changes.
34 EMA (Exponential Moving Average):
Role: The 34 EMA is selected to identify medium-term momentum shifts.
Why 34? The number 34, also aligned with Fibonacci principles, is chosen to provide a more smoothed-out view of price data over a larger number of periods. This helps traders identify medium-term trends while reducing the impact of short-term price fluctuations.
Why This Combination:
- Balanced View: The combination of the 8 EMA and 34 EMA offers a balanced perspective on the market. The 8 EMA responds quickly to short-term changes, while the 34 EMA provides a broader view, capturing trends that unfold over a slightly longer horizon.
- Adaptability: The strategy benefits from the adaptability of the 8 EMA to changing market conditions, allowing traders to respond promptly to short-term shifts in momentum. Meanwhile, the 34 EMA adds stability, filtering out some of the noise and providing a clearer picture of the overall trend.
- Fibonacci Alignment: Aligning the periods with Fibonacci numbers adds an extra layer of systematic structure to the strategy. While the choice of specific Fibonacci numbers is somewhat arbitrary, it’s a systematic way to define the periods that resonates with traders who incorporate Fibonacci principles in their technical analysis.
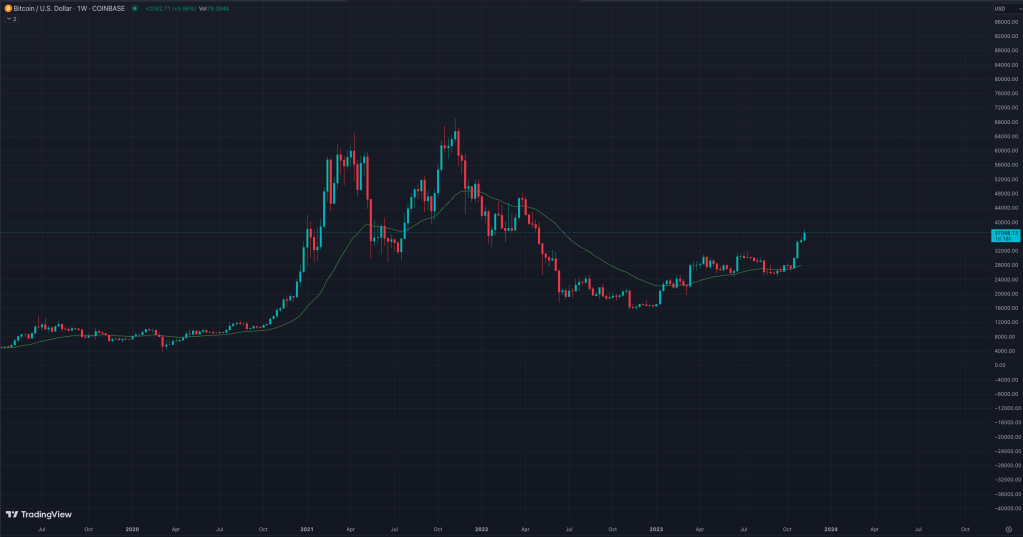
8 EMA / 34 EMA
Role: Identifies momentum shifts.
Signal: Execute a long trade when the 8 EMA crosses over the 34 EMA, indicating a potential uptrend. For a short trade, act when the 8 EMA crosses below the 34 EMA, signaling a potential downtrend.
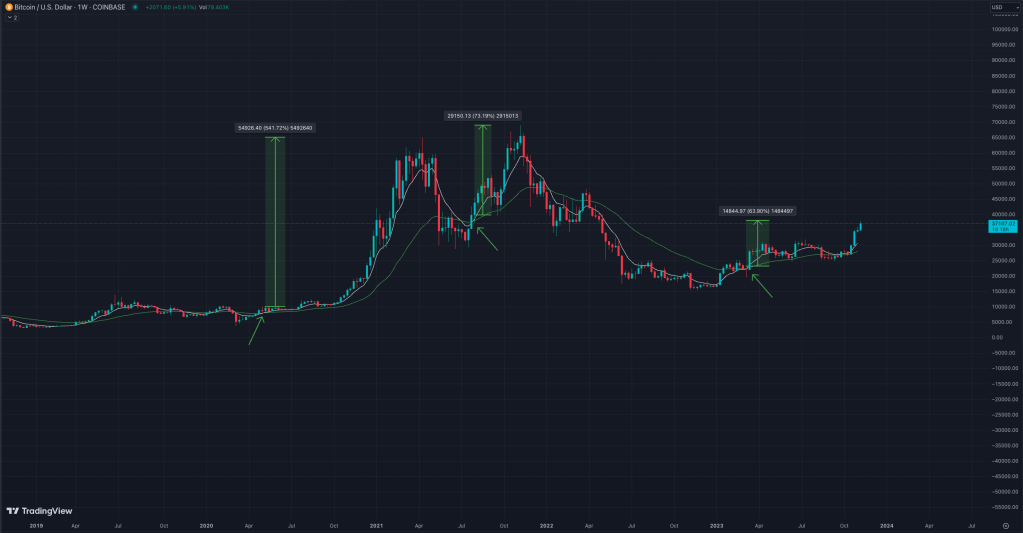
Fibonacci Retracement and Extension:
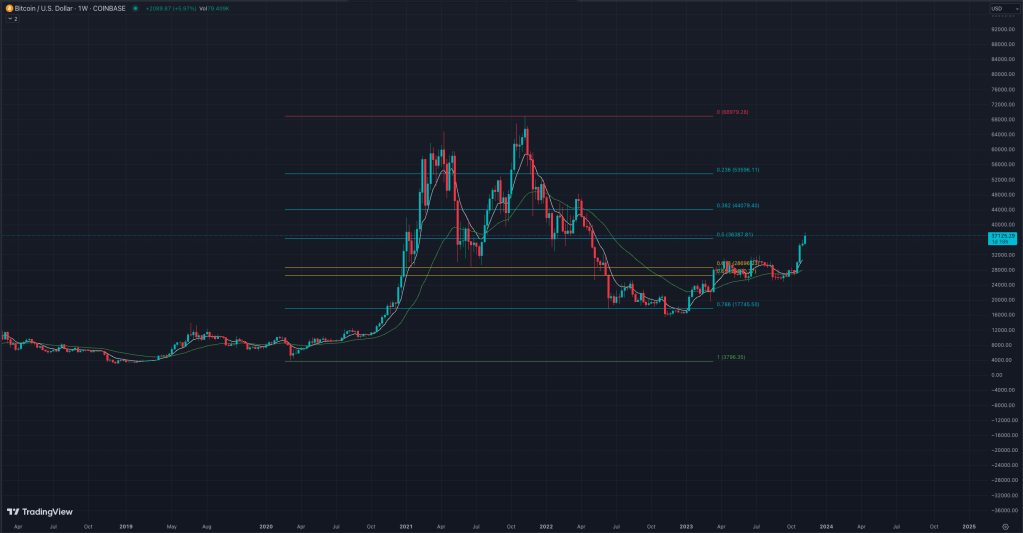
with the extension lines added
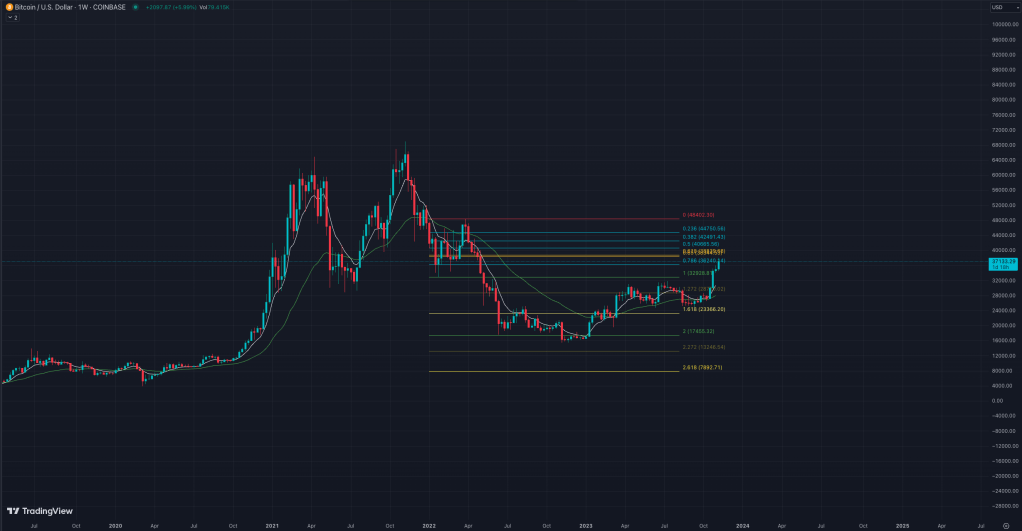
Role: Provides potential support/resistance levels and additional targets for profit-taking.
Implementation: Use Fibonacci retracement from recent swing low to swing high for long trades and swing high to swing low for short trades. Identify key retracement levels (e.g., 38.2%, 50%, 61.8%). Also, apply Fibonacci extension levels (e.g., 127.2%, 161.8%, 200%) to project potential upward or downward extensions.
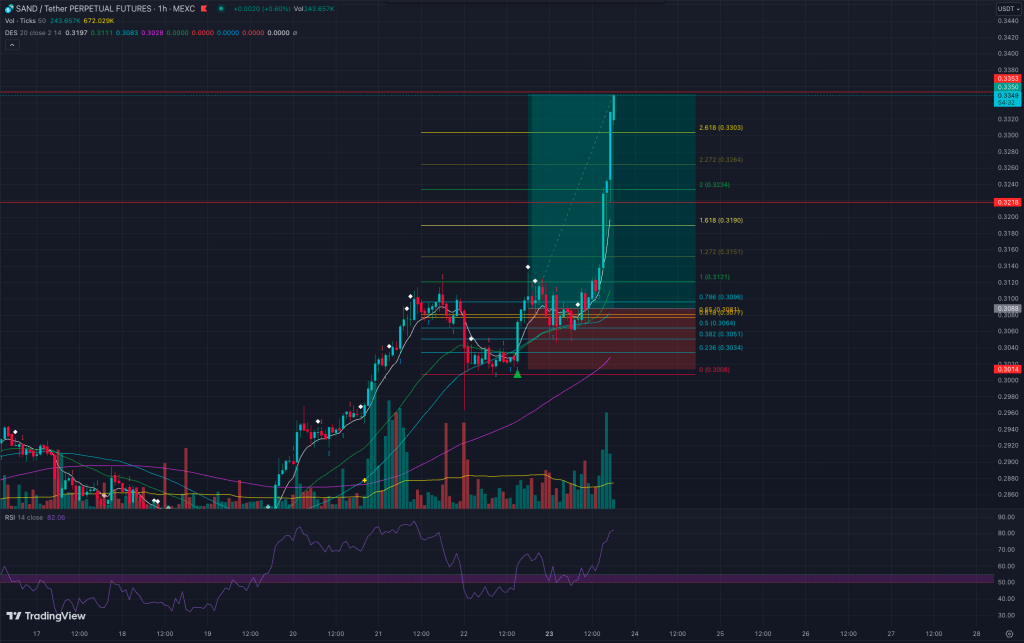
Detailed Long Signal Execution:
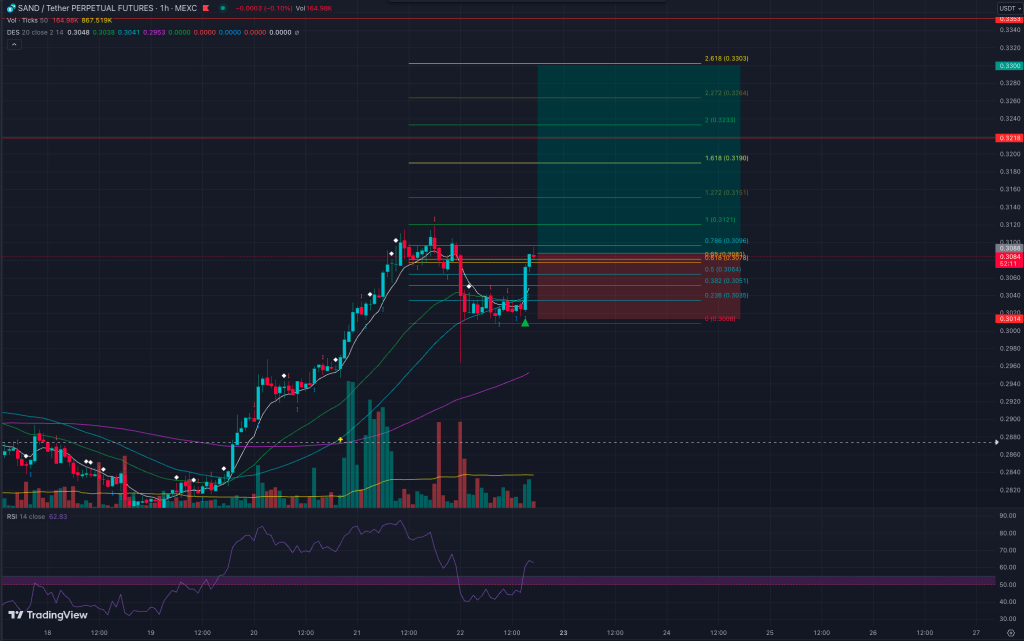
- Trend Confirmation: Verify that the price is above the 99 SMA, indicating a favorable long-term trend.
- Momentum Confirmation: Confirm RSI is above 55, suggesting bullish momentum.
- Short-Term Momentum Shift: Look for the crossover of the 8 EMA above the 34 EMA, signaling a potential entry point for a long trade.
- Fibonacci Retracement and Extension Analysis: Conduct Fibonacci retracement from recent swing low to swing high. Identify key retracement levels and apply Fibonacci extension levels for potential upward extensions.
- Take Profit Targets: Utilize Fibonacci extension levels as potential take profit targets for an extended move. Consider taking partial profits at each level or adjusting stop-loss orders accordingly.
- Risk Management: Implement proper risk management techniques, such as setting a stop-loss order below the recent swing low to limit potential losses.
- Long Trade Execution: Execute a long trade, considering the alignment of trend, momentum, and Fibonacci levels for a comprehensive approach.
Result:
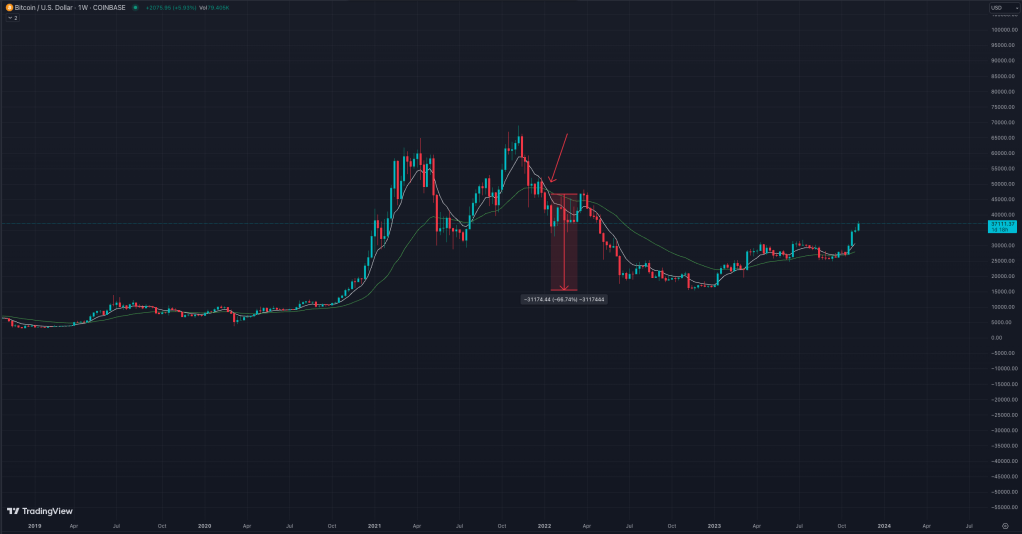
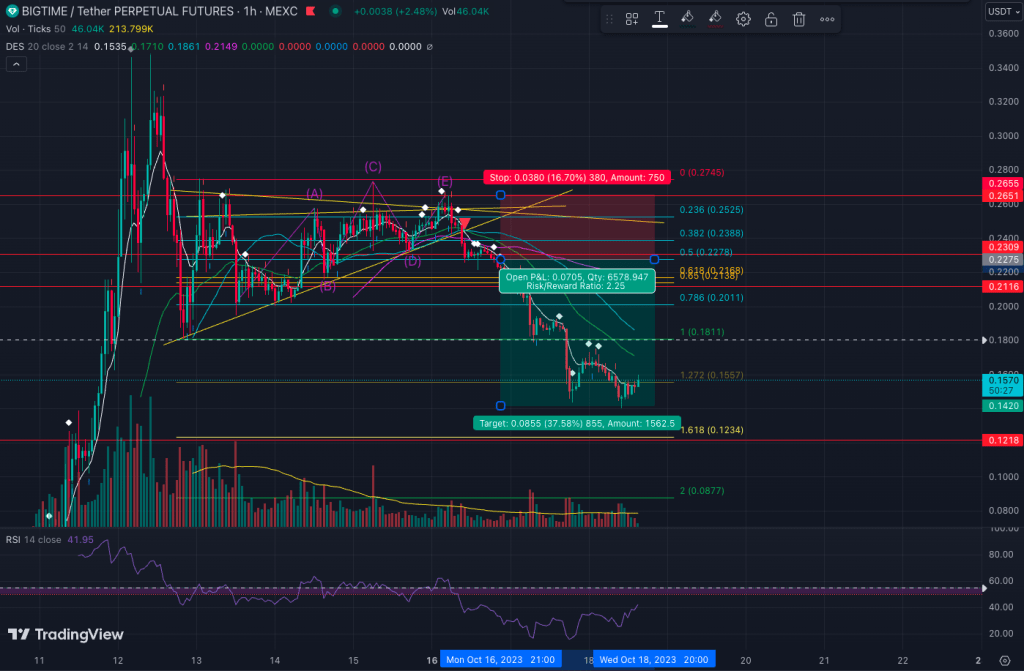
Detailed Short Signal Execution:

- Trend Confirmation: Confirm that the price is below the 99 SMA, indicating a favorable long-term downtrend.
- Momentum Confirmation: Confirm that RSI is below 50, suggesting bearish momentum.
- Short-Term Momentum Shift: Look for the crossover of the 8 EMA below the 34 EMA, signaling a potential entry point for a short trade.
- Fibonacci Retracement and Extension Analysis: Conduct Fibonacci retracement from the recent swing high to swing low. Identify key retracement levels and apply Fibonacci extension levels for potential downward extensions.
- Take Profit Targets: Utilize Fibonacci extension levels as potential take profit targets for an extended move. Consider taking partial profits at each level or adjusting stop-loss orders accordingly.
- Risk Management: Implement proper risk management techniques, such as setting a stop-loss order above the recent swing high to limit potential losses.
- Short Trade Execution: Execute a short trade, considering the alignment of trend, momentum, and Fibonacci levels for a comprehensive approach.
Result:
Additional Notes:
- Be aware of potential confluence zones where Fibonacci levels align with other technical indicators or historical support/resistance levels.
- Consider the broader market context, economic events, and news releases when implementing the strategy for a more holistic approach.
